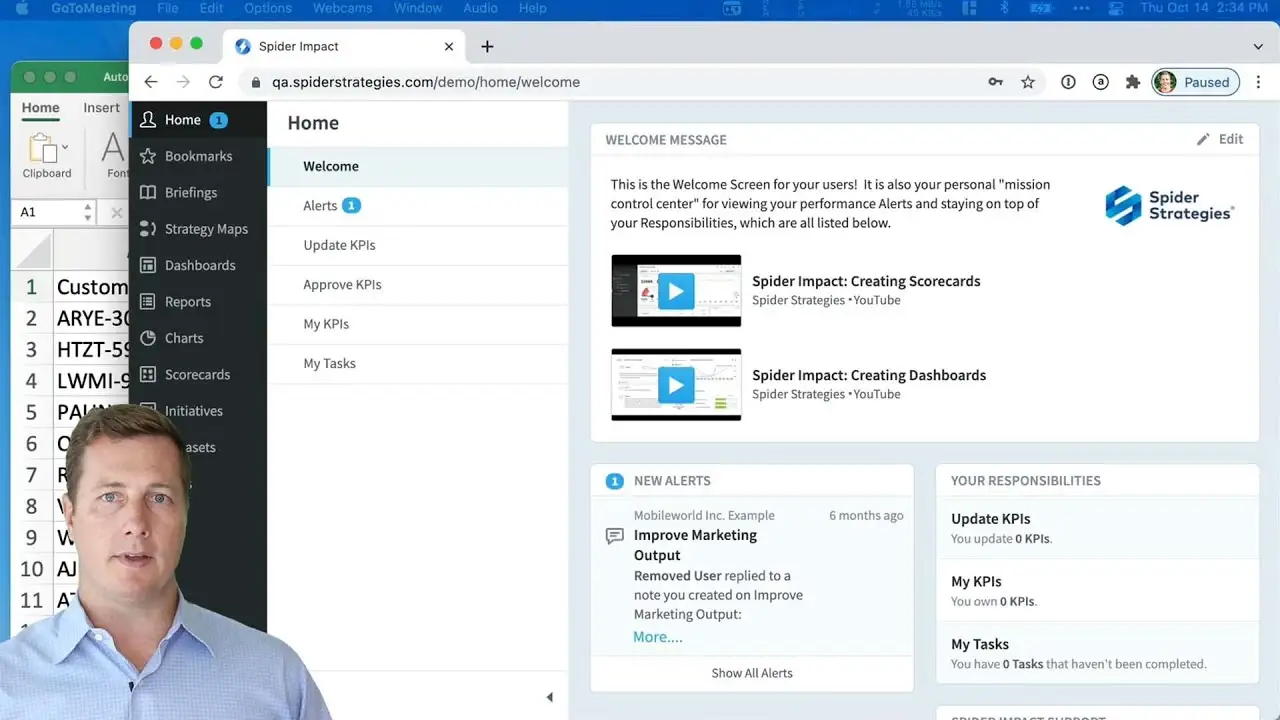
Join us for a one-on-one interactive session to explore Spider Impact and answer your questions in real-time.
We’ll turn your data into a fully functional prototype. Unrestricted 30-day test drive, no credit card required.
Take a quick 3-minute look at your strategy execution and discover opportunities for immediate improvement.
See the value of Briefings for presenting performance data and learn how to quickly create them.
17:19 min
How to build scorecards, create new organizations, and create & manually update Measures/KPIs.
17:06 min
Introduction to creating Initiatives, Tasks, and Milestones and how to relate and present those elements along with the scorecard measures they are intended to affect.
3:35 min
Quickly auto-generate and customize a strategy map in Spider Impact.
16:41 min
Build dashboards with the free-form canvas using chart, bubble, note, speedometer, image, and text widgets.
14:24 min
Learn about how to create charts, including line, bar, pie, area, donut, and many more. Add analytic items like trend lines, forecasts, reference lines and bands, and stacks.
11:27 min
Create reports for scorecard items, initiatives, and datasets. Sort, apply formatting, group, aggregate, and more.
18:57 min
Learn about the business intelligence layer that powers all of Spider Impact. Create, links, update, and explore unstructured data. Create dataset KPIs powered by underlying data.
6:28 min
29:15 min
Automate the creation and updates of scorecards/initiatives from spreadsheets and databases.
14:27 min
If you're building multiple scorecards with similar measures, save a lot of time and effort by using Copy, Templates, and Rollups.
17:58 min
Discover the transformative power of dataset rollup trees with our comprehensive video guide. From the basics to advanced applications, learn how to utilize Spider Impact for aggregating hierarchical data and managing extensive user permissions effortlessly. Using a practical example of fake U.S. Army physical fitness test data, the video demonstrates the step-by-step process of creating and analyzing datasets, including setting up roll-up trees, assigning user permissions, and leveraging data for insights. Perfect for organizations seeking to streamline data management and enhance decision-making capabilities. Watch now to unlock the potential of dataset roll-up trees in your data strategy.
6:35 min
Creating Linked Scorecard Items in Spider Impact. This allows you to track KPIs in one place yet use the data everywhere. Create themed scorecards.
4:55 min
Using Files, Notes, and Related Items to keep information at your fingertips. This allows you to see the relationships between items in the software.
10:16 min
You can create geographic maps in the Charts section that visualize your geographic datasets data. They're fully interactive, allowing you to zoom in and out, filtering your data by region. You can even embed maps on dashboards.
Schedule a personalized tour of Spider Impact, then start your free 30-day trial with your data.